Imagine sunlight hitting a leaf. It seems simple, but within that leaf, a microscopic marvel unfolds: photosynthesis. This isn’t just about plants looking green; it’s the fundamental process converting light energy into chemical energy, stored within the bonds of glucose (a sugar). Think of it as nature’s primary solar power station, creating the fuel that sustains ecosystems. We’ll explore how carbon dioxide and water are transformed, why oxygen is released, and the factors governing this vital process.
C1.3.1: From Sunlight to Sugar Bonds – The Energy Transformation
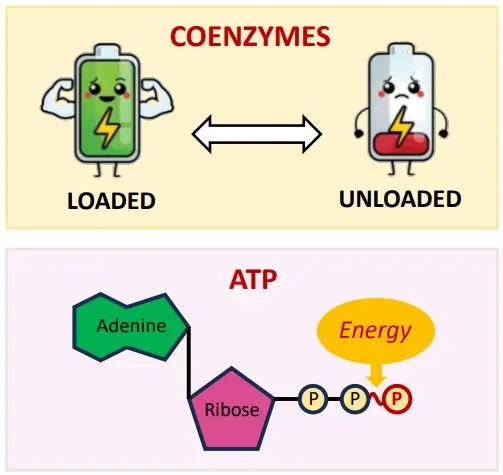
Photosynthesis is, at its core, an energy conversion process.
Input Energy: Light energy (photons) from the sun.
Output Energy: Chemical potential energy stored in the covalent bonds of organic molecules, primarily glucose (C₆H₁₂O₆).
This transformation occurs when organisms produce carbon compounds (like glucose) using light as the energy source. It’s an anabolic process, meaning it builds complex molecules from simpler ones, requiring energy input.
Key Idea: Photosynthesis captures fleeting light energy and locks it away in stable chemical bonds, making energy accessible to the plant and, eventually, to organisms that consume the plant.
C1.3.2 & C1.3.3: Building Blocks and By-products – CO₂, Water, Glucose & Oxygen
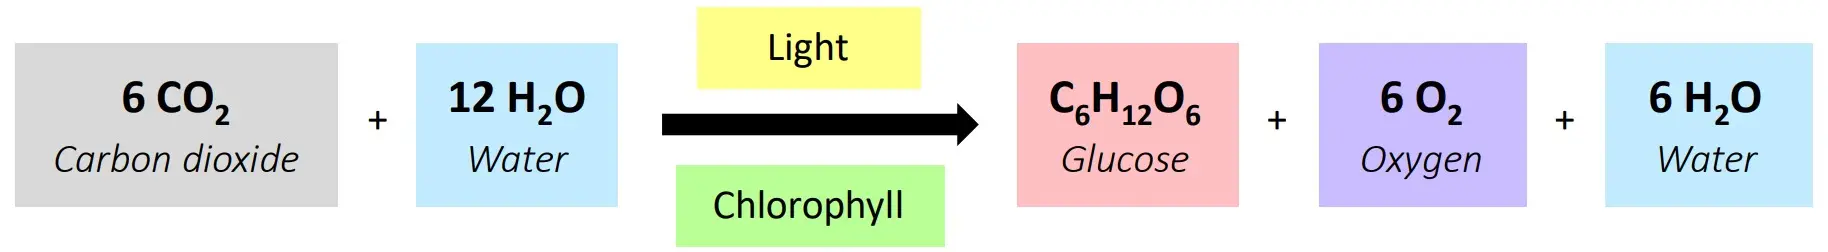
The overall chemical equation for photosynthesis provides a roadmap:
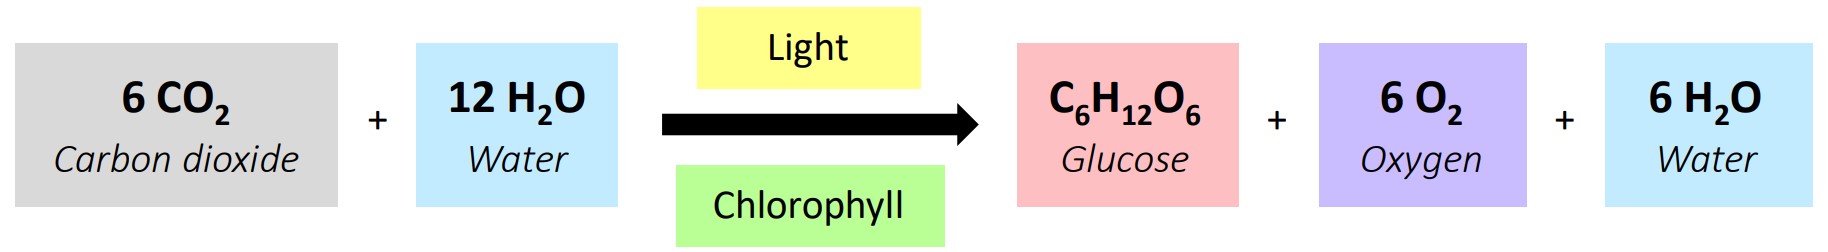
Let’s break this down:
Carbon Dioxide (CO₂): Sourced from the atmosphere, CO₂ provides the carbon atoms needed to build the glucose backbone. This process of incorporating inorganic carbon into organic molecules is called carbon fixation.
Water (H₂O): Absorbed typically through the roots (in plants), water plays a crucial role. Its hydrogen atoms are used (along with electrons) to help reduce carbon dioxide into glucose. Importantly, water is also the source of the oxygen released.
Light Energy: The essential catalyst, providing the energy to drive the reactions.
Glucose (C₆H₁₂O₆): The primary organic product. It’s an energy-rich sugar used by the organism for cellular respiration, growth, or stored as starch.
Oxygen (O₂): Released as a by-product. This oxygen comes specifically from the splitting of water molecules, a process called photolysis (photo = light, lysis = splitting), not from the carbon dioxide.
Who Photosynthesizes? This isn’t exclusive to familiar green plants. It also occurs in:
Algae: Diverse aquatic eukaryotes.
Cyanobacteria: Prokaryotes (formerly known as blue-green algae) that were likely the first organisms to perform oxygenic photosynthesis.
Where in Plants? In eukaryotic cells (plants and algae), photosynthesis takes place within a specialized organelle: the chloroplast.
The Chloroplast: A Specialized Photosynthetic Factory
Understanding the chloroplast’s structure is key:
Outer & Inner Membrane: Regulate passage of substances.
Stroma: The fluid-filled space inside the inner membrane. It contains enzymes, ribosomes, and chloroplast DNA. The light-independent reactions (Calvin cycle) occur here.
Thylakoids: Internal membrane-bound sacs. They often stack into structures called grana (singular: granum). The thylakoid membranes contain chlorophyll and other pigments, photosystems, and electron transport chains. The light-dependent reactions happen here.
Lumen: The fluid-filled space inside a thylakoid.
C1.3.4: Separating Plant Pigments – Chromatography
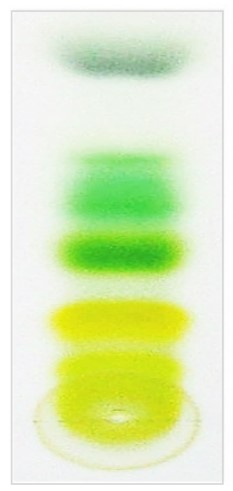
Plants use multiple pigments to capture light. How can we see and identify them? Chromatography is the technique.
Principle: Chromatography separates components of a mixture based on their differing affinities for two phases:
Stationary Phase: A fixed material (e.g., chromatography paper or a thin layer of silica gel).
Mobile Phase: A solvent that moves up or through the stationary phase, carrying the mixture components with it (e.g., acetone or petroleum ether).
How it Works for Pigments:
Pigments are extracted from a leaf (e.g., by grinding with a solvent like acetone).
A concentrated spot of the extract is applied near the bottom of the stationary phase.
The bottom edge is dipped into the mobile phase solvent (making sure the spot stays above the solvent level).
As the solvent moves up the stationary phase via capillary action, it dissolves the pigments and carries them along.
Pigments that are more soluble in the mobile phase and have weaker interactions (adsorption) with the stationary phase will travel further up. Pigments that are less soluble or adhere more strongly will travel shorter distances.
This differential movement separates the pigments into distinct bands or spots. Common pigments you might see separated from a green leaf include chlorophyll a (blue-green), chlorophyll b (yellow-green), xanthophylls (yellow), and carotenoids (orange-yellow).
Identifying Pigments: The Rf Value
To identify the separated pigments, we calculate the Retardation factor (Rf):
Rf = (Distance travelled by pigment) / (Distance travelled by solvent front)
Both distances are measured from the original spot line.
The Rf value is a ratio, so it has no units and is always less than 1.
Under specific conditions (same stationary phase, mobile phase, temperature), a particular pigment will consistently have the same Rf value, allowing for identification by comparison to known standards.
Example: If the solvent front travels 10 cm up the paper, and a yellow pigment (xanthophyll) travels 7 cm, its Rf = 7 cm / 10 cm = 0.7.
C1.3.5 & C1.3.6: Absorbing Light – Pigments, Absorption & Action Spectra
Photosynthetic organisms primarily use wavelengths within the visible light spectrum (approximately 400-700 nanometers).
Pigments and Light Absorption:
Photosynthetic pigments (like chlorophylls and carotenoids) absorb specific wavelengths of light.
When a pigment molecule absorbs a photon of light energy, its electrons become excited (move to a higher energy level). This absorbed energy is what powers photosynthesis.
Chlorophyll a and Chlorophyll b are the main pigments in plants. They absorb light most strongly in the blue-violet (around 400-450 nm) and red (around 650-700 nm) regions of the spectrum.
They reflect green light (around 500-600 nm), which is why plants appear green to us.
Accessory pigments, like carotenoids (which include carotenes and xanthophylls), absorb light in different wavelength ranges (often blue-green light) and pass the energy onto chlorophyll. They broaden the range of light that can be used for photosynthesis and also help protect chlorophyll from photodamage.
Spectra Explained:
Absorption Spectrum: A graph showing the percentage of light absorbed by a specific pigment (or mixture) at each wavelength. It has peaks where absorption is high (e.g., blue and red for chlorophyll) and troughs where absorption is low (e.g., green for chlorophyll).
Action Spectrum: A graph showing the rate of photosynthesis at different wavelengths of light. It essentially shows which wavelengths are most effective at driving the process.
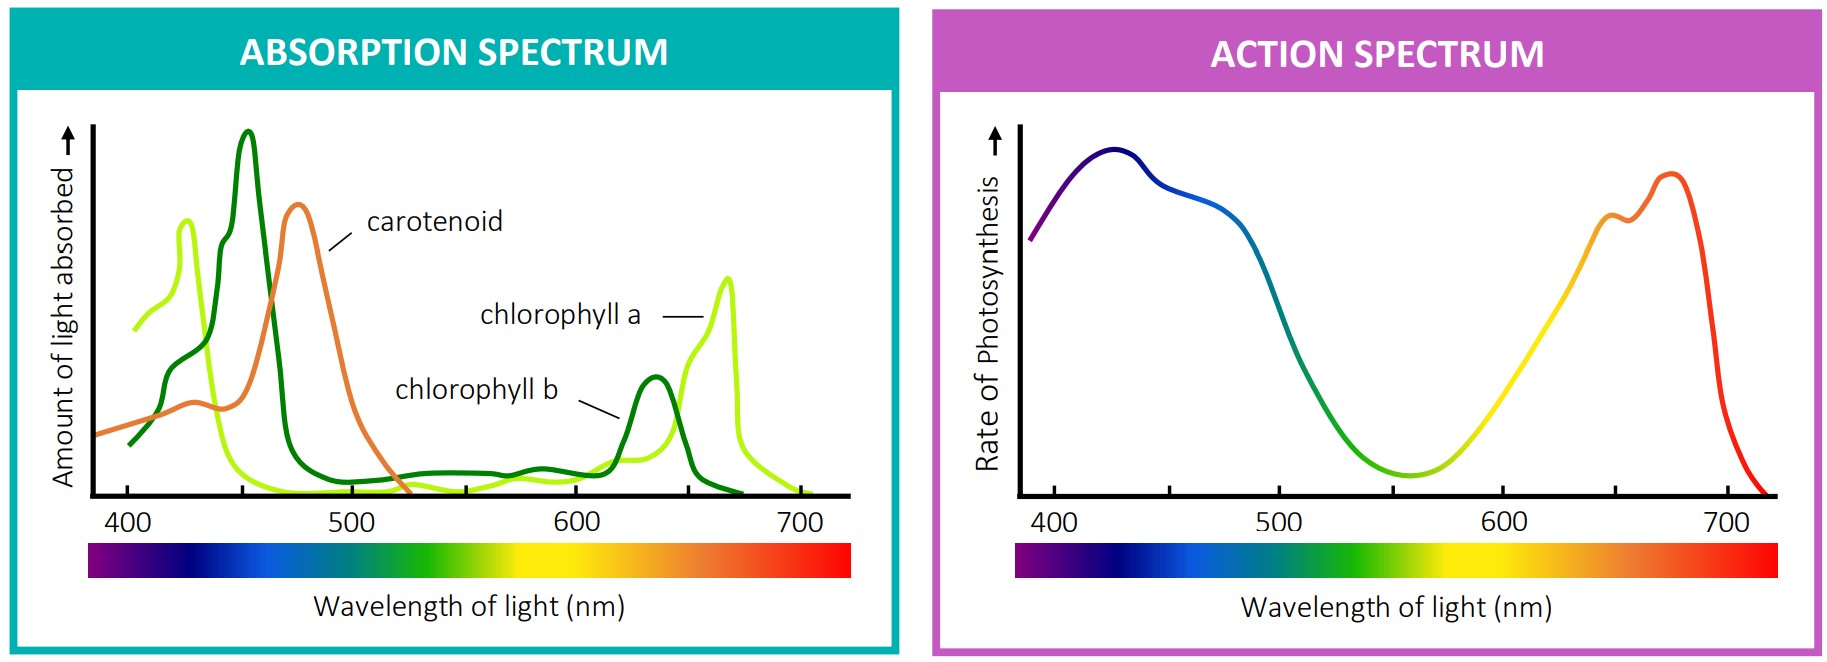
Similarities and Differences:
The action spectrum for photosynthesis generally matches the combined absorption spectra of the major pigments (chlorophylls a & b, carotenoids). This is strong evidence that these pigments are responsible for absorbing the light energy used in photosynthesis.
However, the action spectrum is usually broader than the absorption spectrum of chlorophyll alone. This demonstrates the contribution of accessory pigments, which absorb light at wavelengths where chlorophyll absorbs poorly and transfer that energy to the reaction centres.
The Two Stages of Photosynthesis: A Closer Look
Photosynthesis occurs in two main stages, linked by energy carriers (ATP and NADPH):
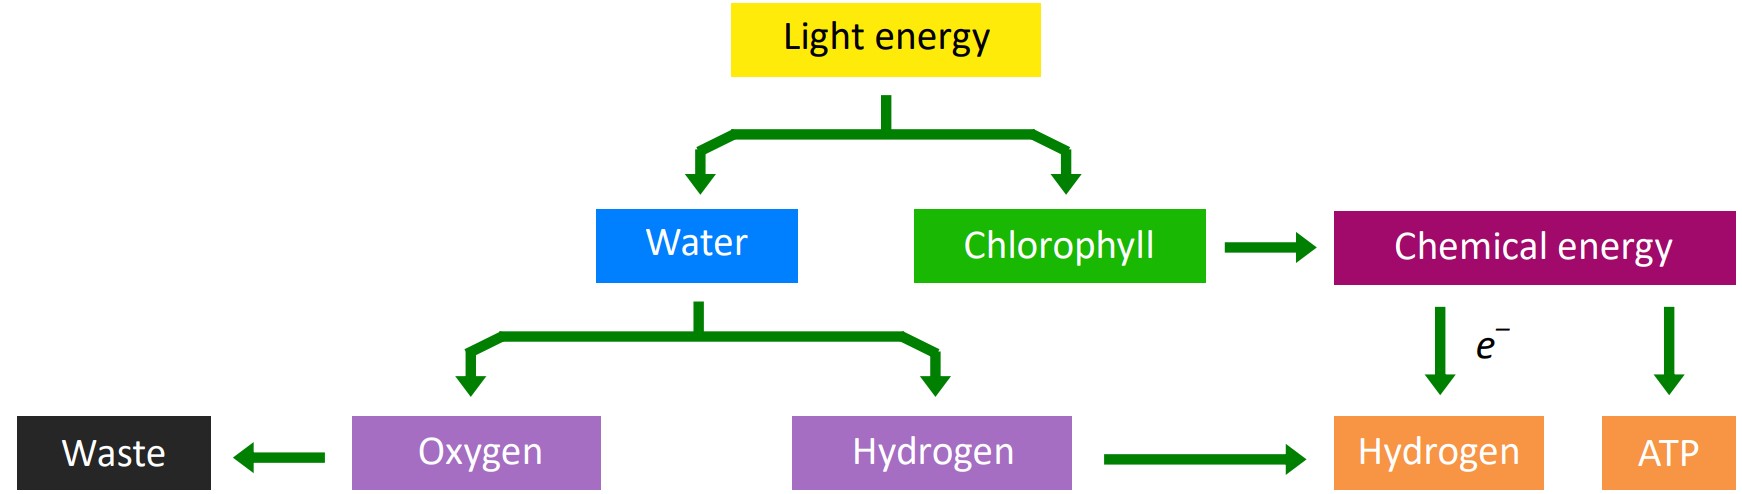
1. Light-Dependent Reactions:
Location: Thylakoid membranes within the chloroplast.
Requires: Direct light energy, water, ADP, and NADP⁺.
Process:
Light energy is absorbed by chlorophyll and accessory pigments clustered in photosystems.
This energy excites electrons.
Photolysis: Light energy splits water molecules (H₂O → 2 H⁺ + 2 e⁻ + ½ O₂). Oxygen is released as waste. The electrons replace those lost by chlorophyll, and the protons (H⁺) contribute to a proton gradient.
Excited electrons pass through an electron transport chain embedded in the thylakoid membrane. As they move, they release energy.
This energy is used to pump protons (H⁺) from the stroma into the thylakoid lumen, creating a proton gradient (electrochemical gradient).
Protons flow back into the stroma down their concentration gradient through an enzyme called ATP synthase. This flow drives the synthesis of ATP (adenosine triphosphate) from ADP and inorganic phosphate (Pi) – a process called photophosphorylation.
Electrons, after passing through the transport chain (in non-cyclic photophosphorylation), are eventually transferred (along with protons) to NADP⁺, reducing it to NADPH.
Outputs: ATP (chemical energy), NADPH (reducing power/electron carrier), and O₂ (by-product).
Key takeaway: The light-dependent reactions capture light energy and convert it into short-term chemical energy stored in ATP and NADPH.
2. Light-Independent Reactions (Calvin Cycle):
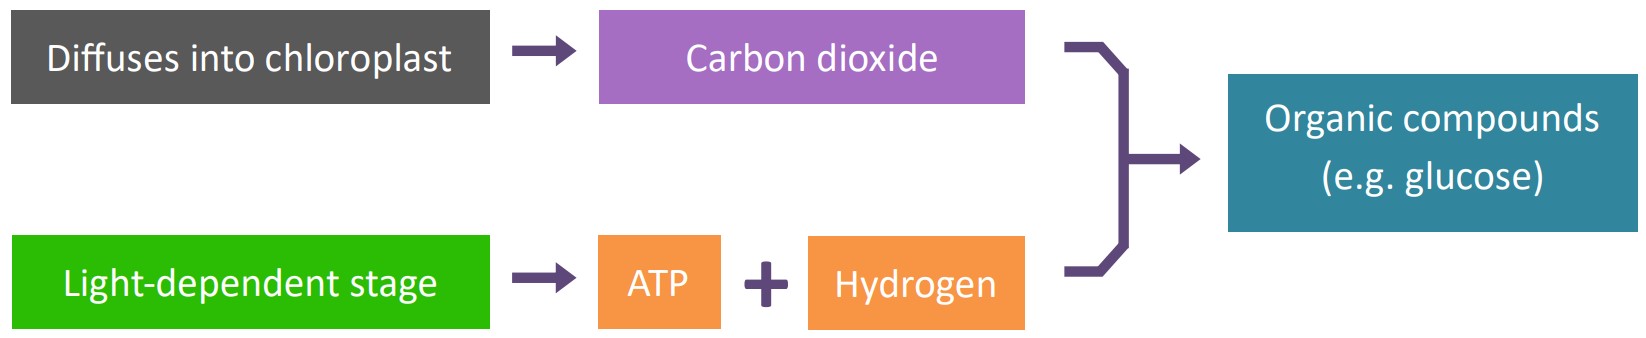
Location: Stroma of the chloroplast.
Requires: ATP and NADPH (from the light-dependent reactions), and Carbon Dioxide (CO₂). Does not directly require light, but relies on the products made using light.
Process (simplified cycle):
Carbon Fixation: CO₂ from the atmosphere enters the stroma. An enzyme called RuBisCO (Ribulose-1,5-bisphosphate carboxylase/oxygenase) attaches each CO₂ molecule to a 5-carbon sugar called ribulose-1,5-bisphosphate (RuBP). This forms an unstable 6-carbon compound that immediately splits into two molecules of a 3-carbon compound (3-PGA).
Reduction: The 3-carbon compound (3-PGA) is then acted upon. Energy from ATP and reducing power (electrons and protons) from NADPH are used to convert each 3-PGA molecule into another 3-carbon molecule called glyceraldehyde-3-phosphate (G3P).
Regeneration: For every 6 molecules of G3P produced, one molecule exits the cycle and can be used by the plant cell to synthesize glucose, sucrose, starch, or other organic molecules. The remaining five G3P molecules, using energy from ATP, are rearranged back into three molecules of the starting RuBP, allowing the cycle to continue.
Outputs: Glucose (or other sugars synthesized from G3P), ADP + Pi, and NADP⁺ (which return to the light-dependent reactions).
Key takeaway: The Calvin cycle uses the chemical energy (ATP) and reducing power (NADPH) generated in the light-dependent reactions to fix CO₂ and synthesize sugars.
C1.3.7: Measuring Photosynthesis & Limiting Factors
We can measure the rate of photosynthesis by monitoring the consumption of reactants or the production of products. Common methods include:
Oxygen Production: Measure the volume of O₂ gas produced over time (e.g., using an aquatic plant like Elodea and counting bubbles or collecting gas in an inverted test tube/using a gas sensor).
Carbon Dioxide Uptake: Measure the change in CO₂ concentration in an enclosed space using a CO₂ sensor, or monitor the change in pH of the surrounding water (CO₂ dissolves in water to form carbonic acid, lowering the pH).
Biomass Increase: Measure the change in the dry mass of a plant or group of plants over time. This is an indirect measure of net photosynthesis (photosynthesis minus respiration) over a longer period.
Limiting Factors:
The rate of photosynthesis is influenced by several environmental factors. The Law of Limiting Factors states that the rate of a process dependent on multiple factors is limited by the factor that is nearest its minimum value.
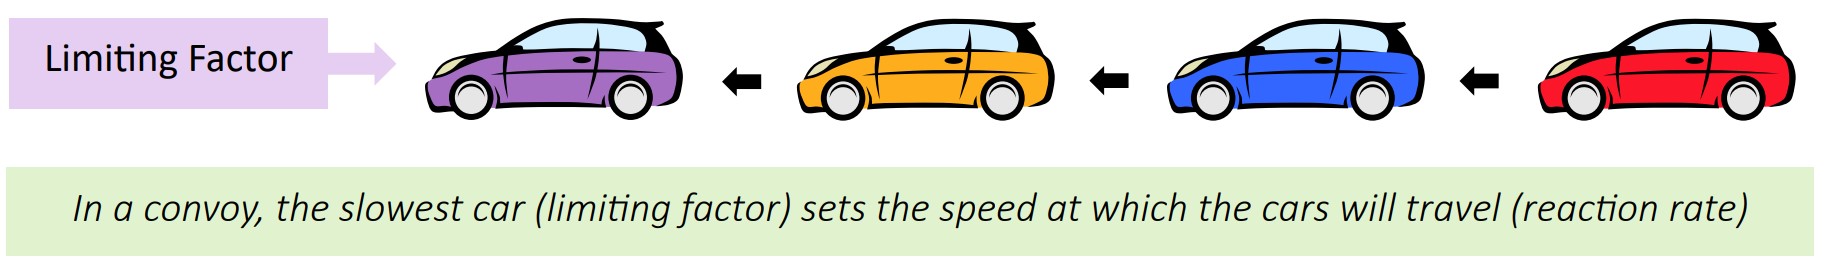
Think of it like an assembly line – the whole process can only go as fast as its slowest step. For photosynthesis, the main limiting factors are:
Light Intensity:
At low light levels, increasing intensity increases the rate (more photons excite more electrons).
At high light levels, the rate plateaus because other factors (like CO₂ concentration or enzyme availability) become limiting, or the light-capturing systems become saturated.
Carbon Dioxide Concentration:
At low CO₂ levels, increasing concentration increases the rate (more substrate for RuBisCO).
At high CO₂ levels, the rate plateaus as light intensity or the capacity of RuBisCO and other enzymes become limiting.
Temperature:
Increasing temperature generally increases the rate (molecules have more kinetic energy, increasing collision frequency for enzyme reactions) up to an optimum temperature.
Beyond the optimum, the rate rapidly decreases as enzymes (like RuBisCO and those in the electron transport chain/Calvin cycle) begin to denature (lose their shape and function) due to excessive heat.
Experimental Design: To investigate the effect of one limiting factor (e.g., light intensity), you must keep the other factors (CO₂ concentration, temperature, water availability) constant and non-limiting to ensure valid results. This is a crucial concept for designing biological experiments (like your IAs!).
C1.3.8: Predicting the Future – Carbon Enrichment Experiments
Atmospheric CO₂ levels are rising due to human activities. How might this affect plant growth and global photosynthesis rates? Carbon enrichment experiments aim to answer this.
Methods:
Enclosed Environments: Growing plants in controlled environments like greenhouses or growth chambers where CO₂ levels can be artificially increased. Allows precise control over other variables (light, temp, water).
Free-Air CO₂ Enrichment (FACE): Releasing CO₂ into the air around plants growing in open field conditions, mimicking future atmospheric conditions more naturally but with less control over other environmental variables.
Findings:
Often, elevated CO₂ initially increases the rate of photosynthesis and plant growth (biomass accumulation), especially in C3 plants (the majority of plant species), as CO₂ is often a limiting factor.
However, plants may acclimate over time, potentially showing a less dramatic response than initially predicted.
Other factors, like nitrogen or water availability, can become limiting, preventing plants from fully utilizing the extra CO₂.
The effects can vary significantly between species and ecosystems.
Importance: These experiments help predict crop yields, forest productivity, and the overall capacity of terrestrial ecosystems to absorb atmospheric CO₂ in a changing climate.